Today I am going to walk though creating a simple analytical pipeline using Azure Data Factory. The Azure Data Factory service is a fully managed service for composing data storage, data processing, and data movement services into streamlined, scalable, and reliable data production pipelines. With Azure Data Factory you can take data from a disparate set of sources both on premise and in the cloud. It allows you to process the data in a variety of ways such as using Pig or Hive as well as allowing you to create custom C# activities. Activities are composed to create a pipeline that takes input sources and output targets. These can be connected together to form a process through which your data flows allowing you to perform complex analysis and processing over the data you have.
In this post I will take a simple use case - an incoming set of tweets from twitter will be processed and the word frequency will be counted and outputted to an Azure SQL table. It will demonstrate the power behind data factory and the speed with which you can get going with it.
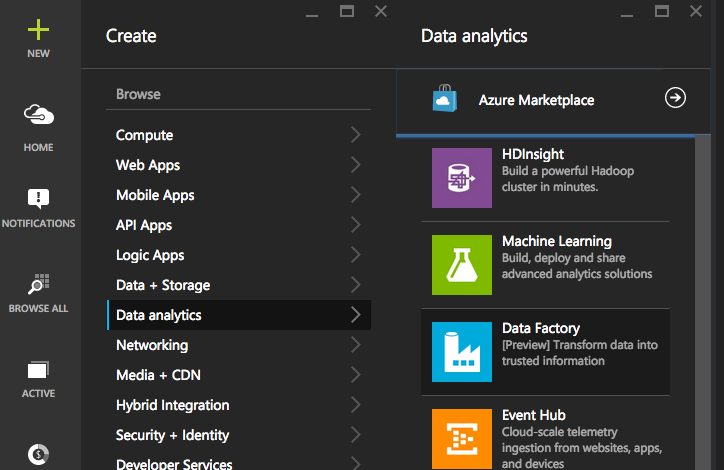
First step is to create an Azure Data Factory service within your subscription. To do this go to the new portal and choose New –> Data Factory
Enter a name for your factory and choose a resource group and press create. This will create your data factory service and bring up the data factory blade.
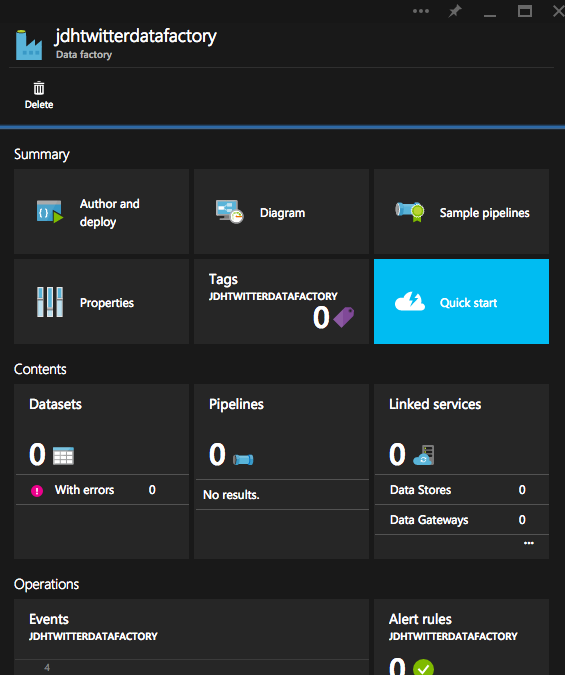
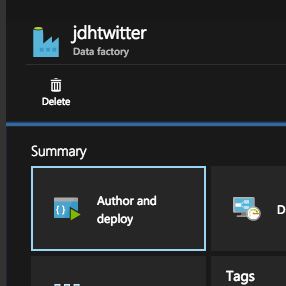
As you can see, there are a variety of options within the blade and we will talk about some of those through the course of this post. The starting point will be the Author and Deploy blade. Clicking this will bring you into the portal’s data factory authoring experience and here you can begin to create your pipelines. But before we even begin there we need to first setup a couple of other aspects to leverage within our data factory pipeline.
- Azure Storage Account
- Azure SQL database
We will be using Azure Blob Storage to store the raw data from twitter in the form of a csv. We will also leverage the same storage account for outputting the HDInsight job data and logs. We will want the final outcome to be stored in a SQL table inside an Azure SQL Database.
First create a storage account - I am calling mine jdhtwitter. Within this storage account, create a container called twitteranalysis. This will be to hold the raw tweets as well as the hive job logs.
While blob storage is a flat storage scheme, you can create a virtual hierarchical structure using / within a filename. So, in this case, I want to create a structure as follows:
twitter > rawdata > tweets.csv.
To do so I upload tweets.csv to filename: twitter/rawdata/tweets.csv.
$destContext = New-AzureStorageContext –StorageAccountName $storageAccount -StorageAccountKey $storageKey
Set-AzureStorageBlobContent -File ".\tweets.csv" -Container $containerName -Context $destContext -Blob "twitter/rawdata/tweets.csv" -Force
At this point my raw input data is uploaded. A useful tool for exploring data in my Azure Storage container is CloudBerry Explorer.
I have to now create my Azure SQL database to hold my output. It is relatively straightforward to create. First you have to create a server and within that you have to create your database. If you don’t have an existing Azure SQL DB server, then you can specify to create a new one when you create a new database.
My database is called jdhstreamingdb and within this I created just one table to hold words and the frequency count.
CREATE TABLE [dbo].[WordCount](
    [ID] [int] IDENTITY(1,1) NOT NULL,
    [Word] [varchar](200) NOT NULL,
    [Count] [int] NOT NULL
 CONSTRAINT [PK_WordCount] PRIMARY KEY CLUSTERED
(
    [ID] ASC
)WITH (PAD_INDEX  = OFF, STATISTICS_NORECOMPUTE  = OFF, IGNORE_DUP_KEY = OFF, ALLOW_ROW_LOCKS  = ON, ALLOW_PAGE_LOCKS  = ON)
) ON [PRIMARY]
At this point my input and output sources are ready to use within my Data Factory.
Within DataFactory bring up the Author & Deploy screen.
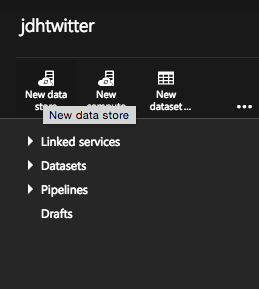
From the top bar choose new datastore. This allows you to add the connection details for a given store. We need to add two - one for the storage account where the raw data lives and one for Azure SQL for the output.
JSON for storage datastore
{
    "name": "StorageLinkedService",
    "properties": {
        "connectionString": "DefaultEndpointsProtocol=https;AccountName=jdhtwitter;AccountKey=**********",
        "hubName": "jdhtwitter_hub",
        "type": "AzureStorageLinkedService"
    }
}
JSON for Azure SQL db
{
    "name": "AzureSqlLinkedService",
    "properties": {
        "connectionString": "Data Source=tcp:bcmkdqqy8h.database.windows.net,1433;Initial Catalog=jdhstreamingdb;Integrated Security=False;User ID=johndh@bcmkdqqy8h;Password=**********;Connect Timeout=30;Encrypt=True",
        "hubName": "jdhtwitter_hub",
        "type": "AzureSqlLinkedService"
    }
}
With those sources defined you have to now create the targeted dataset(s) within those stores you are going to use. You do this by clicking New Dataset.
For input we are targeting the /twitteranalysis/twitter/rawdata/ folder
{
    "name": "TwitterRaw",
    "properties": {
        "published": false,
        "location": {
            "type": "AzureBlobLocation",
            "folderPath": "twitteranalysis/twitter/rawdata",
            "format": {
                "type": "TextFormat",
                "columnDelimiter": ","
            },
            "linkedServiceName": "StorageLinkedService"
        },
        "availability": {
            "frequency": "Hour",
            "interval": 1,
            "waitOnExternal": {}
        }
    }
}
and for output we are targeting the WordCount table.
{
    "name": "WordCountSQLTable",
    "properties": {
        "structure": [
            {
                "position": 0,
                "name": "Word",
                "type": "String"
            },
            {
                "position": 0,
                "name": "Count",
                "type": "Int"
            }
        ],
        "published": false,
        "location": {
            "type": "AzureSqlTableLocation",
            "tableName": "WordCount",
            "linkedServiceName": "AzureSqlLinkedService"
        },
        "availability": {
            "frequency": "Hour",
            "interval": 1
        }
    }
}
As you can see the linkedServiceName links them to the created services we added earlier.
Now, since we are also going to run some complex processing we need to define a New Compute definition. For this I chose On Demand HDInsight Cluster. This means that the HDInsight resources will only be spun up when the pipeline activity runs and will be shut down when done. This is allows you to not have to pay for resources until you need them. The downside is that they have to be provisioned each time so there will be a delay once the activity starts.
{
    "name": "HDInsightOnDemandLinkedService",
    "properties": {
        "version": null,
        "clusterSize": 1,
        "location": null,
        "timeToLive": "00:15:00",
        "jobsContainer": "hivejobs",
        "coreConfiguration": {},
        "hBaseConfiguration": {},
        "hdfsConfiguration": {},
        "hiveConfiguration": {},
        "mapReduceConfiguration": {},
        "oozieConfiguration": {},
        "sparkConfiguration": {},
        "stormConfiguration": {},
        "yarnConfiguration": {},
        "additionalLinkedServiceNames": [],
        "linkedServiceName": "StorageLinkedService",
        "hubName": "jdhtwitter_hub",
        "type": "HDInsightOnDemandLinkedService"
    }
}
We also have to define an interim output for the HDInsight activity. This will be in the same storage container and will be an output of the results which will be used another activity to pick up and insert into Azure SQL.
{
    "name": "TweetCountOutput",
    "properties": {
        "published": false,
        "location": {
            "type": "AzureBlobLocation",
            "folderPath": "twitteranalysis/twitter/aggregate/WordsCount/",
            "format": {
                "type": "TextFormat",
                "columnDelimiter": ","
            },
            "linkedServiceName": "StorageLinkedService"
        },
        "availability": {
            "frequency": "Hour",
            "interval": 1
        }
    }
}
Now we have all input and output defined we have to tie them together. This is done via a pipeline. Choose New Pipeline from the Author and Deploy menu (you have to select the ellipsis in order to see it). Within a pipeline you define activities. Within each activity you define input/output sources as well the transformation you want to happen over your input data before it gets output. Since I want to take my tweets.csv and count the word frequency and just output that I am going to leverage an activity of type HDInsightActivity. This uses the HDInsightOnDemandLinkedService to spin up the HDInsight cluster and allows you pass in a hive query script to perform processing.
{
    "name": "AnalyzeTwitterFeed",
    "properties": {
        "description": "Analyse Twitter feed to determine word count frequency",
        "activities": [
            {
                "type": "HDInsightActivity",
                "transformation": {
                    "scriptPath": "twitteranalysis\\twitter\\scripts\\TwitterWordCount.hql",
                    "scriptLinkedService": "StorageLinkedService",
                    "type": "Hive",
                    "extendedProperties": {
                        "TwitterRaw": "wasb://twitteranalysis@jdhtwitter.blob.core.windows.net/twitter/rawdata/",
                        "WordCount": "wasb://twitteranalysis@jdhtwitter.blob.core.windows.net/twitter/aggregate/WordsCount/"
                    }
                },
                "inputs": [
                    {
                        "name": "TwitterRaw"
                    }
                ],
                "outputs": [
                    {
                        "name": "TweetCountOutput"
                    }
                ],
                "policy": {
                    "timeout": "01:00:00",
                    "concurrency": 1,
                    "executionPriorityOrder": "NewestFirst",
                    "retry": 1
                },
                "name": "AnalyzeData",
                "description": "Analyse Twitter feed to determine Contoso trending",
                "linkedServiceName": "HDInsightOnDemandLinkedService"
            },
            {
                "type": "CopyActivity",
                "transformation": {
                    "source": {
                        "type": "BlobSource"
                    },
                    "sink": {
                        "type": "SqlSink",
                        "writeBatchSize": 0,
                        "writeBatchTimeout": "00:00:00"
                    }
                },
                "inputs": [
                    {
                        "name": "TweetCountOutput"
                    }
                ],
                "outputs": [
                    {
                        "name": "WordCountSQLTable"
                    }
                ],
                "policy": {
                    "timeout": "01:00:00",
                    "concurrency": 1,
                    "executionPriorityOrder": "NewestFirst",
                    "style": "StartOfInterval"
                },
                "name": "WordCountData",
                "description": "Send Word Counts to Azure SQL"
            }
        ],
        "start": "2015-06-16T18:00:00Z",
        "end": "2015-06-17T00:00:00Z",
        "isPaused": false,
        "hubName": "jdhtwitter_hub"
    }
}
My hive query to do this is very simple to create
DROP TABLE IF EXISTS TwitterRaw;
CREATE EXTERNAL TABLE TwitterRaw
(
    ID  int,
    StatusId  string,
    Tweet string,
    Source string,
    UserID string,
    Latitude string,
    Longitutde string,
    InReplyToScreenName string,
    InReplyToStatusID string,
    InReplyToUserID string,
    RetweetedStatus_StatusID string,
    RetweetCount  string,
    InsertedDate string,
    CreatedDate string,
    Query string,
    HourOfDay string,
    TweetType string,
    Platform string,
    Devices string,
    App string
) ROW FORMAT DELIMITED FIELDS TERMINATED BY ',' LINES TERMINATED BY '10' STORED AS TEXTFILE LOCATION '${hiveconf:TwitterRaw}';

CREATE EXTERNAL TABLE WordCount
(
    Word string,
    Count string
) ROW FORMAT delimited fields terminated by ',' LINES TERMINATED BY '10' STORED AS TEXTFILE LOCATION '${hiveconf:WordCount}';

INSERT OVERWRITE TABLE WordCount
select word, count(1) as count from (SELECT explode(split(Tweet, ' ')) AS word FROM TwitterRaw)tempTable group by word;
I have never used hive before and so I looked through some of the examples on the Azure DataFactory github repo to get an idea of how the query language worked.
Essentially you create tables that you then map to the csv files you are inputting. So the first table maps to hiveconf:TwitterRaw which, in the activity, points my tweets.csv file. This populates the table, TwitterRaw, with the raw data. I then create WordCount table and then write a query to run through the data in TwitterRaw and process the word count based on the Tweet field and populate my WordCount table with those results. The WordCount table is mapped to the hiveconf:TweetsCount property which maps to an output location in storage which will output the table to a file. This will allow me to then pick that up and write it to Azure SQL table.
In order to use the hive query in the hive activity, you have to upload it to your storage account and reference it in the activity’s scriptPath property.
Now that the pipeline is complete I can view it in the diagram mode from within the Data Factory blade in the Azure Portal:
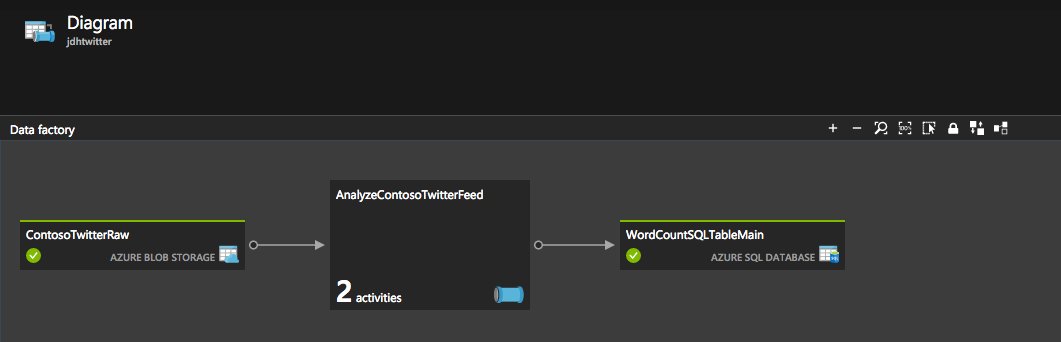
This is a great way to view your pipelines especially as they get more complex.
At this point the pipelines are running and every 1 hour, between the time frames defined for start and end in my pipeline, the pipeline will run. It will pick up the raw tweets, spin up a HDInsight cluster, run the hive query and then copy the output to my Azure SQL database. I can then go and query that table to see the results.
SELECT * FROM WordCount ORDER BY Count DESC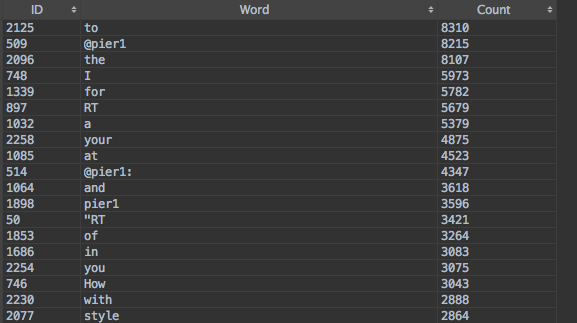
Overall, it was very easy to get going with Azure Data Factory and for large amounts of data that requires processing for insights and analysis - Azure Data Factory is a great service for that.
For more information checkout the Azure Data Factory service documentation which has several tutorials and samples to get you going.